Earlier today, I left my site statistics window open at the dining room table as I went to get Gavin a cup of apple juice. As I was in the kitchen I heard from the dining room “Daddy, I like your painting.” Not having painted anything in about 15 years, I didn’t know what he meant.
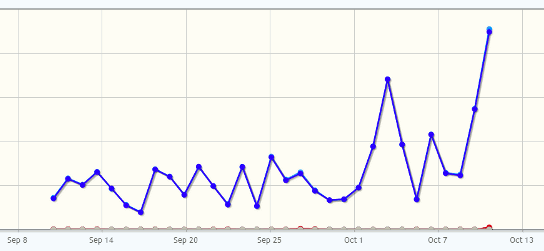
Returning to the dining room, apple juice in hand, I saw him sitting in my chair happily appreciating the artistic merits of the chart of emails sent by day over the past month. I like the chart too, because it shows that SittingAround is growing.
Realizing that he’d never been exposed to visual representations of information before, I though it would be a good idea to give him a quick primer. I expected his attention would last maybe three sentences. Six charts in, having shown him bar charts, spider graphs, x-y plots, and pie charts, I realized he was more interested so I started to probe on understanding.
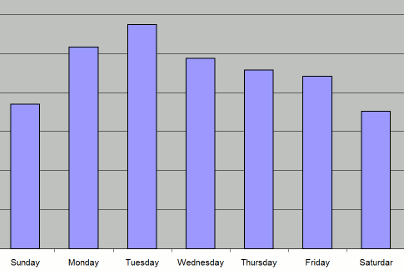
I showed him this bar chart and asked, “Which day do you think we have the most signups?”
Instant and correct answer: “Tuesday.”
So I showed him another chart and asked “Why do you think they call this a spider-graph.” This time answering like I was a bit of a simpleton, he says in his explain-simple-concepts-to-my-parents voice “because it looks like a spider web.”
Touche kindergarten child, touche. Perhaps I’ve underestimated you.
I ask if he’d like to make his own charts, which gets an excited jumping up and down yes. About twenty minutes and three charts later he clearly felt like he’d mastered the topic and was ready to move on to blowing bubbles on the deck. The following are the charts that we created this afternoon.
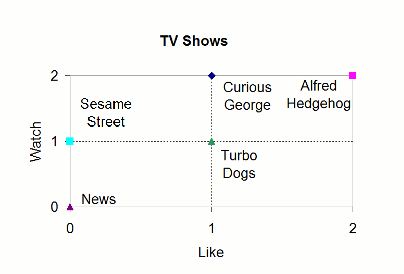
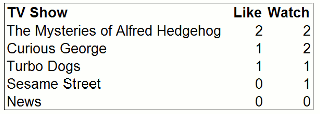
TV Shows, using a simplified X-Y axis
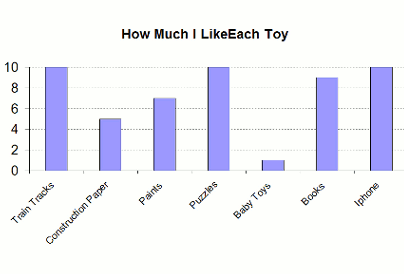
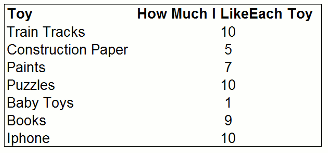
Toy preferences, using a simple bar chart
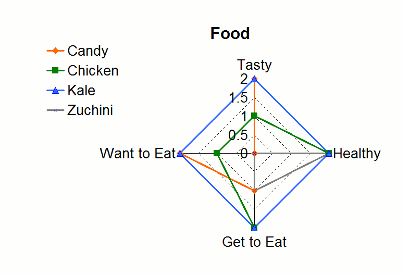
Food, using a four factor spider graph
Gavin’s Summary:
Q: What did you think about daddy showing you charts today?
A: “Awesome, Awesome”
Q: What was your favorite chart?
A: “I think toys, yeah, toys, toys toys”
Q: What is a chart?
A: “I don’t know but I made a chart at school today. Its just a plain old chart, you know, number charts daddy.”
I’m a big proponent of explaining things to kids that are beyond what I think they can understand. I figure it primes them to the basic concepts and words for the next time they are exposed to the idea. It also has the advantage of occasionally finding an area where my son’s comprehension is way beyond what I expect it to be, like happened today.
If you’d like to try this with your own kids, the excel file we used to make these charts is available here. Gavin 5 year old charts.xls
